Data Science Resources
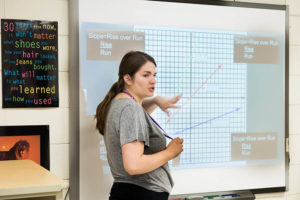
Math Modules for Grades 5 – Algebra II
Data science promotes curiosity and provides context. It is an ideal tool to provide real-world context to the concepts you are already teaching in your classroom. Check out our math modules and the award-winning Statistics and Government lesson plan for free, ready-made lesson plans for your classroom. These lesson plans were created in partnership between K-12 and college faculty and were designed with interesting content and ease of use in mind.
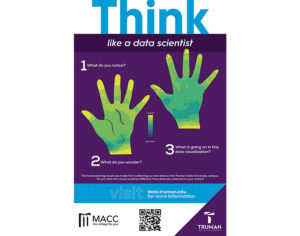
Posters for Your Classroom
Download a free data visualization poster to display in your school or classroom. Posters include a handout with further engagement ideas.
Curriculum Resources
Data is everywhere! We are surrounded by huge amounts of information 24/7. Data science gives us tools to notice patterns and make sense of this overload of information. We can use data science to summarize and tell the story of abstract information.
Data science is an interdisciplinary subject area. It is increasingly important that students are data literate, both for academic work, and to be thoughtful, well-informed citizens. Bringing data science into multiple areas within a student’s education allows for a more robust, contextual experience. Bringing data science into areas beyond the oft thought of math and science allows access for those students who might otherwise be put off. Students can work with data in a variety of ways: by hand, with software, hi-tech, low-tech, collect their own, use created datasets, find things that are interesting to them, etc.
Data science promotes curiosity, encourages deep thinking and provides context. Data science can be a useful tool for all teachers in all content areas. The resources below are divided into different relevant subject areas, as well as by topic, such as datasets or the accessible tools listed in the Basic Toolkit that are easy entrance into the field for any content area. Explore and contact us if you have any questions or would like assistance to figure out how to use a resource in your classroom.
Table of Contents:
The Basic Toolkit features five resources to begin thinking about data with your students right away, regardless of your subject area. These resources are easy to understand and interact with and have potential for high impact on the data literacy of everyone involved.
- Features extremely simple to engage with tools for beginning to analyze data, and includes short, overview videos and lesson plans for how to teach each tool.
- Pulls out some of the Big Ideas for teaching Data Science throughout K-12, includes quick Data Talks to begin introducing data literacy skills in small moments of time. Exploring the website will lead to more resources, including a developed Intro course for high school students.
- The most technical of the Basic Toolkit, CODAP is a great tool for anyone using data in some capacity. If this is new to you, you may need to watch some tutorials to figure everything out, but with a little tutoring and some experimenting it is easy to get started.
Study Hall: Data Literacy – YouTube
- Engaging videos covering the many facets of data literacy at a very basic level (no math required). Most videos are about 10 minutes long.
What’s Going On in This Graph? – The New York Times
- A free offering during the academic year. NYT includes an explainer video of how they run this engaging activity. New graphs posted every Friday, discussion the following Wednesday with the American Statistical Association, and a reveal on Thursday.
Beyond the Basics includes resources that still apply to any educator attempting to add more data based activities to their classroom. These resources include free Data Science textbooks, engaging data visualization resources, fun ways to get students to think about collecting and interacting with data, and thoughtful publications about Data Science.
- Free data science textbook, uses CODAP
- A great tool for anyone using data in some capacity. If this is new to you, you may need to watch some tutorials to figure everything out, but with a little tutoring and some experimenting it is easy to get started.
Data Feminism by Catherine D’Ignazio and Lauren F. Klein
- Open access textbook (or available for purchase) that discusses data science and data science ethics through the lens of intersectional feminism, and how it goes way beyond gender, looking at the power of data science: who has it and who does not. Easy to understand, interesting, and informative for anyone interested in data science.
- Aimed at developing data literacy skills, especially in high school librarians, so they can better assist students learning to read and write with data.
Dear Data THE PROJECT — Dear Data
- A fun, low-tech, easily accessible project that can be recreated with students. Scroll to the bottom of the page for thoughts on how to do the project in your classroom.
- Data visualizations of current topics, beautifully done. Includes resources and a book list for anyone wanting to dive deeper into the world of data visualizations.
- Free personalized professional learning to support teachers and instructional coaches in developing expertise in teaching statistics and data science in grades 6-12, i.e. if you don’t feel 100% confident in your own abilities to teach data literacy skills check out this resource to boost your own understanding.
International Data Science in Schools Project
- Curriculum frameworks for Introductory Data Science to help develop courses for high school.
Misleading Statistics – Real World Examples For Misuse of Data
- An article outlining how statistics can be misleading including actual examples and a funny comic or two. It also touches on additional data literacy skills in evaluating the different visualizations and learning questions to ask and ways to recognize misleading graphics.
- Website providing interesting, interactive, visuals about global issues, including access to their data. They also have prepared, modular lessons that can easily be used within the classroom.
Statistics and Data Science for Teachers
- Free textbook aimed at teaching educators how to teach statistics and data science. Created in partnership with the American Statistical Association.
- Short data talks based on data visualizations, complete with worksheets ready to print for students to see the graph and write their thoughts. Graphs cover many topics and subject areas.
- Stanford professor who has published many scholarly articles related to data science education, and who teaches classes about teaching data science at the K-12 level.
Weapons of Math Destruction by Cathy O’Neil
- An easy to read book about the darker side, and sometimes unforeseen, consequences of the ever growing world of data science.
What Is Data Visualization? Definition, Examples, And Learning Resources
- Data visualization primer created by Tableau.
- Middle and high school team program that works to apply data science to solve real problems. No previous knowledge needed, for 15-30 students and one advisor. They provide a bootcamp to teach your team the basics needed to work on the quest.
These resources include created lesson plans, full classes, textbooks, and guidelines. You can use them as is or modify them to fit your needs.
- Free data science textbook, uses CODAP
- Free, research-based, integrated Computer Science and Data Science modules for Math, Science, Business and Social Studies classes grades 5-12.
- Interactive data science textbook that is free to pilot, and includes free, comprehensive professional development.
Data and Districts: Gerrymandering and Big Data in American Democracy
- Created lesson plan for high school government and statistics classes that looks at the intersection between the constitutional principle of apportionment, partisan gerrymandering, and data science.
- Pulls out some of the Big Ideas for teaching Data Science throughout K-12, includes quick Data Talks to begin introducing data literacy skills in small moments of time. Exploring the website will lead to more resources, including a developed Intro course for high school students.
- Data literacy class designed for ages 12-16. Register for the course via the Outschool platform. Almost free at $1 per course.
Data Science Resource Repository
- Data Science resource list compiled by the Northeast Big Data Innovation Hub geared towards high school and up students and their associated educators. Resources are divided between educators, learners and multimedia.
Data Stories | Urban Institute
- Free, created lesson plans to help educators guide students through different datasets and the stories they might find there. Each story is a starter kit for educators at different levels–grades 3-5, grades 6-8, or grades 9-12.
IDS Data Science
- Developed data science curriculum for high school. Not free, but upon registration and a required 2 year commitment from the school district, the course is ready to go and provides professional development and support throughout the prodataclassgram.
International Data Science in Schools Project
- Curriculum frameworks for Introductory Data Science to help develop courses for high school.
- Free mini lessons, lesson plans, story maps, and data visualizations for grades 3-12.
Pre-K–12 Guidelines for Assessment and Instruction in Statistics Education II (GAISE II)
- A framework for statistics and data science education created by the National Council of Teachers of Mathematics and endorsed by the American Statistical Association.
Resource Library — DataClassroom
- Free lesson plans, curated data nuggets, and raw datasets with background story.
- Website providing interesting, interactive, visuals about global issues, including access to their data. They also have prepared, modular lessons that can easily be used within the classroom.
Resources for Data Science Education | DS4E Coalition
- Data Science resources compiled by Data Science 4 Everyone divided into Teach, Learn, Datasets, and Document Library. Information includes a short description, appropriate grade levels, and any software needs.
Resources for Educators Using Data in the Classroom
- A compiled list of data activities, lessons, and resources for the classroom, sorted by grade level.
Stanford: Teaching Data science in Secondary School
- Syllabus for a Stanford University course with the primary emphasis on tools and techniques for teaching secondary grade level data science and data science integration. Includes project ideas, relevant readings, videos, etc., and examines many aspects of data science as its own subject and how different content areas might teach data science principles.
Statistics and Data Science for Teachers
- Free textbook aimed at teaching educators how to teach statistics and data science. Created in partnership with the American Statistical Association.
Truman State University Data Science Math Modules
- Individual data science math modules created for use in 5th grade – Algebra II classrooms, showcasing how data science can be incorporated into math curriculum already being taught.
- Short data talks based on data visualizations, complete with worksheets ready to print for students to see the graph and write their thoughts. Graphs cover many topics and subject areas.
- Free, curriculum modules to promote statistical thinking and data literacy through investigations of social and economic conditions in the U.S. Designed for math classrooms.
- Free resources that are suitable for secondary school educators in math, physical sciences, social sciences, computers and more. Requires signing up and then the free materials are sent to your email.
These resources will lead you to datasets that you can use in your classroom. Many include tutorials for how to best use their website. CODAP is a useful tool for your data analysis.
Census Bureau Data
- Data from the U.S. Census Bureau, including tutorials, ready to use tools, visualizations, as well as accessible data.
- CORGIS: The Collection of Really Great, Interesting, Situated Datasets. Datasets compiled by Virginia Tech and ready for download, some include background details about the data.
Data and Districts: Gerrymandering and Big Data in American Democracy
- Created lesson plan for high school government and statistics classes that looks at the intersection between the constitutional principle of apportionment, partisan gerrymandering, and data science.
- Searchable archive of hundreds of datafiles, including background information and a source reference when possible. You can search by text or statistical method, and filter the number of cases.
- A weekly newsletter of useful/curious datasets, including a full archive. You can sign-up to receive the newsletter via email.
- Free classroom activities designed by teachers and scientists to allow students to work with real scientific data as they practice looking for patterns and developing explanations about natural phenomena.
- The home of the U.S. Government’s open access data. Find data, tools, and resources to conduct research, design data visualizations, and more.
Google Dataset Search
- Google supported search engine specifically for datasets.
Internet Resources for Data Analysis
- An alphabetical list of data analysis resources compiled by NICHE, a project of the City University of New York (CUNY) Quantitative Reasoning Alliance.
- Free census and survey data from around the world integrated across time and space. IPUMS integration and documentation allows one to study change, conduct comparative research, merge information across data types, and analyze individuals within family and community contexts. Creator Steven Ruggles was named a 2022 MacArthur Fellow.
Kaggle Find Open Datasets and Machine Learning Projects | Kaggle
- Free, searchable, Kaggle community published data and code. They also have free courses related to Data Science concepts.
- Free mini lessons, lesson plans, story maps, and data visualizations for grades 3-12.
- Website providing interesting, interactive, visuals about global issues, including access to their data. They also have prepared, modular lessons that can easily be used within the classroom.
Resources for Data Science Education | DS4E Coalition
- Data Science resources compiled by Data Science 4 Everyone divided into Teach, Learn, Datasets, and Document Library. Information includes a short description, appropriate grade levels, and any software needs.
Resource Library — DataClassroom
- Free lesson plans, curated data nuggets, and raw datasets with background story.
- Created lesson plans for middle school that uses CODAP for working with the datasets provided.
Truman State University Data Science Math Modules
- Individual data science math modules created for use in 5th grade – Algebra II classrooms, showcasing how data science can be incorporated into math curriculum already being taught.
- Data from the U.S. Census Bureau, including tutorials, ready to use tools, visualizations, as well as accessible data.
These resources all relate to data visualizations. There are examples (of good and bad), ways to create your own, prepared Data Talks, and resources to deepen your understanding of the critical thought required to create and interact with data visualizations.
- Free data science textbook, uses CODAP
- A great tool for anyone using data in some capacity. If this is new to you, you may need to watch some tutorials to figure everything out, but with a little tutoring and some experimenting it is easy to get started.
Data and Districts: Gerrymandering and Big Data in American Democracy
- Created lesson plan for high school government and statistics classes that looks at the intersection between the constitutional principle of apportionment, partisan gerrymandering, and data science.
- Features extremely simple to engage with tools for beginning to analyze data, and includes short, overview videos and lesson plans for how to teach each tool.
- Pulls out some of the Big Ideas for teaching Data Science throughout K-12, includes quick Data Talks to begin introducing data literacy skills in small moments of time. Exploring the website will lead to more resources, including a developed Intro course for high school students.
Data Stories | Urban Institute
- Free, created lesson plans to help educators guide students through different datasets and the stories they might find there. Each story is a starter kit for educators at different levels–grades 3-5, grades 6-8, or grades 9-12.
- Data visualizations of current topics, beautifully done. Includes resources and a book list for anyone wanting to dive deeper into the world of data visualizations.
- Created, artistic maps as a generative theme. Also discusses color considerations, perception, etc. From this link you can also access the larger website including other map sets and created lesson plans.
- Creator of original, amusing, data visualizations. Often using a real world item combined with a created graphic to simply and effectively communicate ideas. Could be a great resource for students trying to think a little outside the box when it is time to communicate information or create a data visualization.
Misleading Statistics – Real World Examples For Misuse of Data
- An article outlining how statistics can be misleading including actual examples and a funny comic or two. It also touches on additional data literacy skills in evaluating the different visualizations and learning questions to ask and ways to recognize misleading graphics.
- Free mini lessons, lesson plans, story maps, and data visualizations for grades 3-12.
NASA Engaging Space Data Visualizations
- A compilation of the different data visualizations you can access via different NASA projects.
New Forms of History: Critiquing Data and Its Representations | The American Historian
- Article discussing how to critique data visualizations and why that is important. Also features a couple interesting visualizations.
- Prepared lessons, articles and resources related to data literacy, including a building block guideline, visuals and lessons to help students choose and analyze graph types, and more.
- Website providing interesting, interactive, visuals about global issues, including access to their data. They also have prepared, modular lessons that can easily be used within the classroom.
RIDDLE – Research in Design for Discovery in Learning Experiences
- Highlights interesting student projects for data visualizations, often outside of the usually thought of charts and graphs.
- Instructional method to help students make better sense of graphs, includes interesting graphs as examples.
START HERE – WDS Data Story Bytes (DataBytes) Teacher Guide
- Lesson plans for short data talks, including the data visualization, related questions, and possible teacher prompts.
- Data visualization tool designed for middle school and up. License purchase required to work outside of preview mode.
Truman State University Data Science Math Modules
- Individual data science math modules created for use in 5th grade – Algebra II classrooms, showcasing how data science can be incorporated into math curriculum already being taught.
- Short data talks based on data visualizations, complete with worksheets ready to print for students to see the graph and write their thoughts. Graphs cover many topics and subject areas.
- Data from the U.S. Census Bureau, including tutorials, ready to use tools, visualizations, as well as accessible data.
What Is Data Visualization? Definition, Examples, And Learning Resources
- Data visualization primer created by Tableau.
What’s Going On in This Graph? – The New York Times
- A free offering during the academic year. NYT includes an explainer video of how they run this engaging activity. New graphs posted every Friday, discussion the following Wednesday with the American Statistical Association, and a reveal on Thursday.
These resources either relate directly to using data in Art, Music, and/or Theater classes or can be used that way with a little creative thinking. To jump in right away with a hands-on activity check out the Dear Data project or make Data Sculptures.
- Article looking at ways to incorporate digital and low-tech versions of data visualizations and how those can help students engage with the material and move beyond fact collecting and closer to thinking like a professional in the field. In particular, in creating their own visualizations students were able to make deeper, more sophisticated connections between the information provided.
ASA Data Visualization Poster Competition for Grades K–12
- Poster competition with cash prizes. Often used for science projects, but there is not any subject area limitation, just guidelines for the type of question, data collected, etc. Could be from any area with student and teacher interest.
Building Data Literacy Through the Arts
- Overview of data literacy projects created for middle school art students. These projects go way beyond a simple chart or graph and work to meet students where they are, not just the students already interested in math and science.
Curriculum Connections with Scratch!
- Scratch coding is a free coding program. The “curriculum connections” outlines ideas for how to incorporate the software in disciplines beyond computer science.
- Features extremely simple to engage with tools for beginning to analyze data, and includes short, overview videos and lesson plans for how to teach each tool.
- Website led by Professor Rahul Bhargava that includes many ideas for how to make data more accessible for all, including data sculptures and data theater.
Data Feminism by Catherine D’Ignazio and Lauren F. Klein
- Open access textbook (or available for purchase) that discusses data science and data science ethics through the lens of intersectional feminism, and how it goes way beyond gender, looking at the power of data science: who has it and who does not. Easy to understand, interesting, and informative for anyone interested in data science.
Data Literacy as a STEAM Activity for Youth
- From Professor Rahul Bhargava (see Data Culture Group), information about quick ways to have students work with data as art and how it raises the engagement level.
Dear Data THE PROJECT — Dear Data
- A fun, low-tech, easily accessible project that can be recreated with students. Scroll to the bottom of the page for thoughts on how to do the project in your classroom.
- Website for research project that aimed to analyze large-scale data for melodic patterns in jazz performances.
- Data visualizations of current topics, beautifully done. Includes resources and a book list for anyone wanting to dive deeper into the world of data visualizations.
integrated Computational Thinking
- National Science Foundation funded project aiming to support middle school teachers to include computational thinking integrated learning experiences in their pedagogy, specifically focused on social studies, English language arts, and art.
- Free personalized professional learning to support teachers and instructional coaches in developing expertise in teaching statistics and data science in grades 6-12, i.e. if you don’t feel 100% confident in your own abilities to teach data literacy skills check out this resource to boost your own understanding.
- Website providing free educational lessons covering a wide variety of topics: art, reading and language arts, history, math, science, computing, life skills, etc.
Machine Learning and the Social Studies
- Article outlining different machine learning projects teachers can use to interact with different digital collections including Dig that Lick and Google Arts & Culture Art Palette and MoMA’s interactive archive.
- Created, artistic maps as a generative theme. Also discusses color considerations, perception, etc. From this link you can also access the larger website including other map sets and created lesson plans.
- Creator of original, amusing, data visualizations. Often using a real world item combined with a created graphic to simply and effectively communicate ideas. Could be a great resource for students trying to think a little outside the box when it is time to communicate information or create a data visualization.
- (The proof is in) The Pudding is a digital publication that creates visual essays about interesting cultural data. They are often pretty, sometimes interactive, and have occasionally gone viral.
Thoughts On Designing Data Sculptures
- Original website of Professor Rahul Bhargava (see Data Culture Group). This particular article goes into detail about making data sculptures.
Resources for Data Science Education | DS4E Coalition
- Data Science resources compiled by Data Science 4 Everyone divided into Teach, Learn, Datasets, and Document Library. Information includes a short description, appropriate grade levels, and any software needs.
RIDDLE – Research in Design for Discovery in Learning Experiences
- Highlights interesting student projects for data visualizations, often outside of the usually thought of charts and graphs.
Stanford: Teaching Data science in Secondary School
- Syllabus for a Stanford University course with the primary emphasis on tools and techniques for teaching secondary grade level data science and data science integration. Includes project ideas, relevant readings, videos, etc., and examines many aspects of data science as its own subject and how different content areas might teach data science principles.
Study Hall: Data Literacy – YouTube
- Engaging videos covering the many facets of data literacy at a very basic level (no math required). Most videos are about 10 minutes long.
- Short data talks based on data visualizations, complete with worksheets ready to print for students to see the graph and write their thoughts. Graphs cover many topics and subject areas.
- Stanford professor who has published many scholarly articles related to data science education, and who teaches classes about teaching data science at the K-12 level.
What’s Going On in This Graph? – The New York Times
- A free offering during the academic year. NYT includes an explainer video of how they run this engaging activity. New graphs posted every Friday, discussion the following Wednesday with the American Statistical Association, and a reveal on Thursday.
These resources either relate directly to using data in Computer Science classes or can be used that way with a little creative thinking. Coding, AI, and machine learning are all parts of the larger data science field. To jump in right away consider a coding program like Code.org, checking out the AI Crash Course on YouTube, playing with machine learning programs, or discussing what kind of code might be useful to create visuals for data talks such as those seen in the NYT What’s Going On in This Graph?
Artificial Intelligence – YouTube
- Engaging videos covering basic information about artificial intelligence and machine learning. Most videos are between 10-15 minutes long.
- Links to a poster overviewing the 5 big ideas in Artificial Intelligence. Looking around the main site one can find guidelines for AI education, resource directory, and a community focused on the AI for K-12 audience.
- Coding program with free “Hour of Code” programs, free trials, and subscription plans for teachers and kids aged 5-14.
- Free coding program with created lesson content organized by grade level, creator of Hour of Code program, and includes additional resources for learning to code.
Curriculum Connections with Scratch!
- Scratch coding is a free coding program. The “curriculum connections” outlines ideas for how to incorporate the software in disciplines beyond computer science.
- Data literacy class designed for ages 12-16. Register for the course via the Outschool platform. Almost free at $1 per course.
Data Feminism by Catherine D’Ignazio and Lauren F. Klein
- Open access textbook (or available for purchase) that discusses data science and data science ethics through the lens of intersectional feminism, and how it goes way beyond gender, looking at the power of data science: who has it and who does not. Easy to understand, interesting, and informative for anyone interested in data science.
Data Science Resource Repository
- Data Science resource list compiled by the Northeast Big Data Innovation Hub geared towards high school and up students and their associated educators. Resources are divided between educators, learners and multimedia.
- Courses for teachers to improve their skills in data and science literacy. Some resources are paid and some are free.
IDS Data Science
- Developed data science curriculum for high school. Not free, but upon registration and a required 2 year commitment from the school district, the course is ready to go and provides professional development and support throughout the program.
- Data visualizations of current topics, beautifully done. Includes resources and a book list for anyone wanting to dive deeper into the world of data visualizations.
- Free personalized professional learning to support teachers and instructional coaches in developing expertise in teaching statistics and data science in grades 6-12, i.e. if you don’t feel 100% confident in your own abilities to teach data literacy skills check out this resource to boost your own understanding.
International Data Science in Schools Project
- Curriculum frameworks for Introductory Data Science to help develop courses for high school.
- Website providing free educational lessons covering a wide variety of topics: art, reading and language arts, history, math, science, computing, life skills, etc.
Machine Learning and the Social Studies
- Article outlining different machine learning projects teachers can use to interact with different digital collections.
Resources for Data Science Education | DS4E Coalition
- Data Science resources compiled by Data Science 4 Everyone divided into Teach, Learn, Datasets, and Document Library. Information includes a short description, appropriate grade levels, and any software needs.
RIDDLE – Research in Design for Discovery in Learning Experiences
- Highlights interesting student projects for data visualizations, often outside of the usually thought of charts and graphs.
Stanford: Teaching Data science in Secondary School
- Syllabus for a Stanford University course with the primary emphasis on tools and techniques for teaching secondary grade level data science and data science integration. Includes project ideas, relevant readings, videos, etc., and examines many aspects of data science as its own subject and how different content areas might teach data science principles.
Statistics and Data Science for Teachers
- Free textbook aimed at teaching educators how to teach statistics and data science. Created in partnership with the American Statistical Association.
- Short data talks based on data visualizations, complete with worksheets ready to print for students to see the graph and write their thoughts. Graphs cover many topics and subject areas.
- Stanford professor who has published many scholarly articles related to data science education, and who teaches classes about teaching data science at the K-12 level.
Weapons of Math Destruction by Cathy O’Neil
- An easy to read book about the darker side, and sometimes unforeseen, consequences of the ever growing world of data science.
What’s Going On in This Graph? – The New York Times
- A free offering during the academic year. NYT includes an explainer video of how they run this engaging activity. New graphs posted every Friday, discussion the following Wednesday with the American Statistical Association, and a reveal on Thursday.
- Free resources that are suitable for secondary school educators in math, physical sciences, social sciences, computers and more. Requires signing up and then the free materials are sent to your email.
- Middle and high school team program that works to apply data science to solve real problems. No previous knowledge needed, for 15-30 students and one advisor. They provide a bootcamp to teach your team the basics needed to work on the quest.
These resources either relate directly to using data in English classes or can be used that way with a little creative thinking. To jump in right away check out the Dear Data project or have your students analyze a text with one or more of the DataBasic tools.
- Article looking at ways to incorporate digital and low-tech versions of data visualizations and how those can help students engage with the material and move beyond fact collecting and closer to thinking like a professional in the field. In particular, in creating their own visualizations students were able to make deeper, more sophisticated connections between the information provided.
ASA Data Visualization Poster Competition for Grades K–12
- Poster competition with cash prizes. Often used for science projects, but there is not any subject area limitation, just guidelines for the type of question, data collected, etc. Could be from any area with student and teacher interest.
Curriculum Connections with Scratch!
- Scratch coding is a free coding program. The “curriculum connections” outlines ideas for how to incorporate the software in disciplines beyond computer science.
- Features extremely simple to engage with tools for beginning to analyze data, and includes short, overview videos and lesson plans for how to teach each tool.
Data Feminism by Catherine D’Ignazio and Lauren F. Klein
- Open access textbook (or available for purchase) that discusses data science and data science ethics through the lens of intersectional feminism, and how it goes way beyond gender, looking at the power of data science: who has it and who does not. Easy to understand, interesting, and informative for anyone interested in data science.
- Aimed at developing data literacy skills, especially in high school librarians, so they can better assist students learning to read and write with data.
Dear Data THE PROJECT — Dear Data
- A fun, low-tech, easily accessible project that can be recreated with students. Scroll to the bottom of the page for thoughts on how to do the project in your classroom.
- Data visualizations of current topics, beautifully done. Includes resources and a book list for anyone wanting to dive deeper into the world of data visualizations.
- Free personalized professional learning to support teachers and instructional coaches in developing expertise in teaching statistics and data science in grades 6-12, i.e. if you don’t feel 100% confident in your own abilities to teach data literacy skills check out this resource to boost your own understanding.
integrated Computational Thinking
- National Science Foundation funded project aiming to support middle school teachers to include computational thinking integrated learning experiences in their pedagogy, specifically focused on social studies, English language arts, and art.
- Website providing free educational lessons covering a wide variety of topics: art, reading and language arts, history, math, science, computing, life skills, etc.
- (The proof is in) The Pudding is a digital publication that creates visual essays about interesting cultural data. They are often pretty, sometimes interactive, and have occasionally gone viral.
Resources for Data Science Education | DS4E Coalition
- Data Science resources compiled by Data Science 4 Everyone divided into Teach, Learn, Datasets, and Document Library. Information includes a short description, appropriate grade levels, and any software needs.
RIDDLE – Research in Design for Discovery in Learning Experiences
- Highlights interesting student projects for data visualizations, often outside of the usually thought of charts and graphs.
Stanford: Teaching Data science in Secondary School
- Syllabus for a Stanford University course with the primary emphasis on tools and techniques for teaching secondary grade level data science and data science integration. Includes project ideas, relevant readings, videos, etc., and examines many aspects of data science as its own subject and how different content areas might teach data science principles.
Study Hall: Data Literacy – YouTube
- Engaging videos covering the many facets of data literacy at a very basic level (no math required). Most videos are about 10 minutes long.
- Short data talks based on data visualizations, complete with worksheets ready to print for students to see the graph and write their thoughts. Graphs cover many topics and subject areas.
- Stanford professor who has published many scholarly articles related to data science education, and who teaches classes about teaching data science at the K-12 level.
What’s Going On in This Graph? – The New York Times
- A free offering during the academic year. NYT includes an explainer video of how they run this engaging activity. New graphs posted every Friday, discussion the following Wednesday with the American Statistical Association, and a reveal on Thursday.
These resources either relate directly to using data in Math classes or can be used that way with a little creative thinking. To jump in right away check out some of the data talks available through the New York Times, Turner’s Graph of the Week, and DataBytes, or check out the moving graphs available at GapMinder. To involve everyone in working with the data directly, start using CODAP or check out some of the prepared data science lessons. There is great potential to partner with a colleague in another subject area to work on interesting data and to apply context to that data.
ASA Data Visualization Poster Competition for Grades K–12
- Poster competition with cash prizes. Often used for science projects, but there is not any subject area limitation, just guidelines for the type of question, data collected, etc. Could be from any area with student and teacher interest.
- Blog about teaching introductory statistics based on the philosophy: ask good questions. Created by an introductory statistics professor with over 30 years of experience teaching students and professional development.
- Free data science textbook, uses CODAP
- Free, research-based, integrated Computer Science and Data Science modules for Math, Science, Business and Social Studies classes grades 5-12.
- A great tool for anyone using data in some capacity. If this is new to you, you may need to watch some tutorials to figure everything out, but with a little tutoring and some experimenting it is easy to get started.
- Interactive data science textbook that is free to pilot, and includes free, comprehensive professional development.
Curriculum Connections with Scratch!
- Scratch coding is a free coding program. The “curriculum connections” outlines ideas for how to incorporate the software in disciplines beyond computer science.
Data and Districts: Gerrymandering and Big Data in American Democracy
- Created lesson plan for high school government and statistics classes that looks at the intersection between the constitutional principle of apportionment, partisan gerrymandering, and data science.
- Pulls out some of the Big Ideas for teaching Data Science throughout K-12, includes quick Data Talks to begin introducing data literacy skills in small moments of time. Exploring the website will lead to more resources, including a developed Intro course for high school students.
- Data literacy class designed for ages 12-16. Register for the course via the Outschool platform. Almost free at $1 per course.
Data Feminism by Catherine D’Ignazio and Lauren F. Klein
- Open access textbook (or available for purchase) that discusses data science and data science ethics through the lens of intersectional feminism, and how it goes way beyond gender, looking at the power of data science: who has it and who does not. Easy to understand, interesting, and informative for anyone interested in data science.
Data Literacy as a STEAM Activity for Youth
- From Professor Rahul Bhargava (see Data Culture Group), information about quick ways to have students work with data as art and how it raises the engagement level.
Data Science Resource Repository
- Data Science resource list compiled by the Northeast Big Data Innovation Hub geared towards high school and up students and their associated educators. Resources are divided between educators, learners and multimedia.
Data Stories | Urban Institute
- Free, created lesson plans to help educators guide students through different datasets and the stories they might find there. Each story is a starter kit for educators at different levels–grades 3-5, grades 6-8, or grades 9-12.
- Features extremely simple to engage with tools for beginning to analyze data, and includes short, overview videos and lesson plans for how to teach each tool.
- Courses for teachers to improve their skills in data and science literacy. Some resources are paid and some are free.
Dear Data THE PROJECT — Dear Data
- A fun, low-tech, easily accessible project that can be recreated with students. Scroll to the bottom of the page for thoughts on how to do the project in your classroom.
Dynamic Data Science | STEM Resource Finder
- Data science activities embedded within CODAP.
Fall Data Challenge | This is Statistics
- Annual data challenge for high school and up students. Teams of 2-5, with a different challenge each year.
Hollylynne S. Lee MOOC and Free Online Courses
- Statistics and math MOOC courses created by a Professor of Mathematics and Statistics Education in the department of Science, Technology, Engineering, and Mathematics Education at NC State.
IDS Data Science
- Developed data science curriculum for high school. Not free, but upon registration and a required 2 year commitment from the school district, the course is ready to go and provides professional development and support throughout the program.
- Data visualizations of current topics, beautifully done. Includes resources and a book list for anyone wanting to dive deeper into the world of data visualizations.
- Free personalized professional learning to support teachers and instructional coaches in developing expertise in teaching statistics and data science in grades 6-12, i.e. if you don’t feel 100% confident in your own abilities to teach data literacy skills check out this resource to boost your own understanding.
International Data Science in Schools Project
- Curriculum frameworks for Introductory Data Science to help develop courses for high school.
- Website providing free educational lessons covering a wide variety of topics: art, reading and language arts, history, math, science, computing, life skills, etc.
LOCUS Levels of Conceptual Understanding in Statistics
- National Science Foundation project focused on developing assessments of statistical understanding using the GAISE II framework.
Misleading Statistics – Real World Examples For Misuse of Data
- An article outlining how statistics can be misleading including actual examples and a funny comic or two. It also touches on additional data literacy skills in evaluating the different visualizations and learning questions to ask and ways to recognize misleading graphics.
- Prepared lessons, articles and resources related to data literacy, including a building block guideline, visuals and lessons to help students choose and analyze graph types, and more.
Pre-K–12 Guidelines for Assessment and Instruction in Statistics Education II (GAISE II)
- A framework for statistics and data science education created by the National Council of Teachers of Mathematics and endorsed by the American Statistical Association.
Resource Library — DataClassroom
- Free lesson plans, curated data nuggets, and raw datasets with background story.
- Website providing interesting, interactive, visuals about global issues, including access to their data. They also have prepared, modular lessons that can easily be used within the classroom.
Resources for Data Science Education | DS4E Coalition
- Data Science resources compiled by Data Science 4 Everyone divided into Teach, Learn, Datasets, and Document Library. Information includes a short description, appropriate grade levels, and any software needs.
Resources for Educators Using Data in the Classroom
- A compiled list of data activities, lessons, and resources for the classroom, sorted by grade level.
RIDDLE – Research in Design for Discovery in Learning Experiences
- Highlights interesting student projects for data visualizations, often outside of the usually thought of charts and graphs.
- Instructional method to help students make better sense of graphs, includes interesting graphs as examples.
- Data Snacks are free, quick, created content based off of US Census data. Social explorer as a larger website is a premium tool that allows easy interaction with census data.
Stanford: Teaching Data science in Secondary School
- Syllabus for a Stanford University course with the primary emphasis on tools and techniques for teaching secondary grade level data science and data science integration. Includes project ideas, relevant readings, videos, etc., and examines many aspects of data science as its own subject and how different content areas might teach data science principles.
START HERE – WDS Data Story Bytes (DataBytes) Teacher Guide
- Lesson plans for short data talks, including the data visualization, related questions, and possible teacher prompts.
Statistics and Data Science for Teachers
- Free textbook aimed at teaching educators how to teach statistics and data science. Created in partnership with the American Statistical Association.
- Engaging videos about statistics, created off the AP Statistics requirements. Most videos are between 10-15 minutes long.
Statsketball Tournament | This is Statistics
- Annual statistical challenge for high school students and up to predict the winner of NCAA basketball March Madness tournament.
Study Hall: Data Literacy – YouTube
- Engaging videos covering the many facets of data literacy at a very basic level (no math required). Most videos are about 10 minutes long.
- Created lesson plans for middle school that uses CODAP for working with the datasets provided.
- Data visualization tool designed for middle school and up. License purchase required to work outside of preview mode.
Truman State University Data Science Math Modules
- Individual data science math modules created for use in 5th grade – Algebra II classrooms, showcasing how data science can be incorporated into math curriculum already being taught.
- Short data talks based on data visualizations, complete with worksheets ready to print for students to see the graph and write their thoughts. Graphs cover many topics and subject areas.
- Data exploration platform with created content and curated datasets for math and science. Limited access for free, unlimited access with a premium account.
- Data from the U.S. Census Bureau, including tutorials, ready to use tools, visualizations, as well as accessible data.
- Free, curriculum modules to promote statistical thinking and data literacy through investigations of social and economic conditions in the U.S. Designed for math classrooms.
- Stanford professor who has published many scholarly articles related to data science education, and who teaches classes about teaching data science at the K-12 level.
Weapons of Math Destruction by Cathy O’Neil
- An easy to read book about the darker side, and sometimes unforeseen, consequences of the ever growing world of data science.
What Is Data Visualization? Definition, Examples, And Learning Resources
- Data visualization primer created by Tableau.
What’s Going On in This Graph? – The New York Times
- A free offering during the academic year. NYT includes an explainer video of how they run this engaging activity. New graphs posted every Friday, discussion the following Wednesday with the American Statistical Association, and a reveal on Thursday.
- Free resources that are suitable for secondary school educators in math, physical sciences, social sciences, computers and more. Requires signing up and then the free materials are sent to your email.
- Middle and high school team program that works to apply data science to solve real problems. No previous knowledge needed, for 15-30 students and one advisor. They provide a bootcamp to teach your team the basics needed to work on the quest.
- Citizen science website with exportable data that can then be used on CODAP, Google sheets, etc. We used the Penguin Watch project for a 7th grade data science math module.
These resources either relate directly to using data in Science classes or can be used that way with a little creative thinking. To jump in right away check out some of the data talks available through the New York Times, Turner’s Graph of the Week, and DataBytes, or check out the moving graphs available at GapMinder. To involve everyone in working with the data directly, start using CODAP or check out some of the prepared data science lessons. A great way to work data science into your science curriculum is to work with data from citizen science projects. Also, check out “Smelling Like Data Science” from the author of the free textbook Awash in Data, for thoughts on how to move from science data to data science data.
ASA Data Visualization Poster Competition for Grades K–12
- Poster competition with cash prizes. Often used for science projects, but there is not any subject area limitation, just guidelines for the type of question, data collected, etc. Could be from any area with student and teacher interest.
- Free data science textbook, uses CODAP
- Free, research-based, integrated Computer Science and Data Science modules for Math, Science, Business and Social Studies classes grades 5-12.
- A great tool for anyone using data in some capacity. If this is new to you, you may need to watch some tutorials to figure everything out, but with a little tutoring and some experimenting it is easy to get started.
Curriculum Connections with Scratch!
- Scratch coding is a free coding program. The “curriculum connections” outlines ideas for how to incorporate the software in disciplines beyond computer science.
- Data literacy class designed for ages 12-16. Register for the course via the Outschool platform. Almost free at $1 per course.
Data Feminism by Catherine D’Ignazio and Lauren F. Klein
- Open access textbook (or available for purchase) that discusses data science and data science ethics through the lens of intersectional feminism, and how it goes way beyond gender, looking at the power of data science: who has it and who does not. Easy to understand, interesting, and informative for anyone interested in data science.
Data Literacy as a STEAM Activity for Youth
- From Professor Rahul Bhargava (see Data Culture Group), information about quick ways to have students work with data as art and how it raises the engagement level.
- Free classroom activities designed by teachers and scientists to allow students to work with real scientific data as they practice looking for patterns and developing explanations about natural phenomena.
Data Stories | Urban Institute
- Free, created lesson plans to help educators guide students through different datasets and the stories they might find there. Each story is a starter kit for educators at different levels–grades 3-5, grades 6-8, or grades 9-12.
- Features extremely simple to engage with tools for beginning to analyze data, and includes short, overview videos and lesson plans for how to teach each tool.
- Courses for teachers to improve their skills in data and science literacy. Some resources are paid and some are free.
Dear Data THE PROJECT — Dear Data
- A fun, low-tech, easily accessible project that can be recreated with students. Scroll to the bottom of the page for thoughts on how to do the project in your classroom.
Dynamic Data Science | STEM Resource Finder
- Data science activities embedded within CODAP.
Earth Science Puzzles: Making Meaning From Data
- Science book to guide teachers in using data based activities to teach students in 8th-12th grade about earth science. Designed to be low threshold for the teacher and high impact for the students.
- Citizen science website, also includes training courses for data literacy and data ethics.
- Citizen science website with free, created lessons to go along with the data created by projects hosted on this site.
- Data visualizations of current topics, beautifully done. Includes resources and a book list for anyone wanting to dive deeper into the world of data visualizations.
- Free personalized professional learning to support teachers and instructional coaches in developing expertise in teaching statistics and data science in grades 6-12, i.e. if you don’t feel 100% confident in your own abilities to teach data literacy skills check out this resource to boost your own understanding.
International Data Science in Schools Project
- Curriculum frameworks for Introductory Data Science to help develop courses for high school.
- Website providing free educational lessons covering a wide variety of topics: art, reading and language arts, history, math, science, computing, life skills, etc.
- Free mini lessons, lesson plans, story maps, and data visualizations for grades 3-12.
NASA Engaging Space Data Visualizations
- A compilation of the different data visualizations you can access via different NASA projects.
- Prepared lessons, articles and resources related to data literacy, including a building block guideline, visuals and lessons to help students choose and analyze graph types, and more.
Resource Library — DataClassroom
- Free lesson plans, curated data nuggets, and raw datasets with background story.
Resources for Data Science Education | DS4E Coalition
- Data Science resources compiled by Data Science 4 Everyone divided into Teach, Learn, Datasets, and Document Library. Information includes a short description, appropriate grade levels, and any software needs.
Resources for Educators Using Data in the Classroom
- A compiled list of data activities, lessons, and resources for the classroom, sorted by grade level.
- Website providing interesting, interactive, visuals about global issues, including access to their data. They also have prepared, modular lessons that can easily be used within the classroom.
RIDDLE – Research in Design for Discovery in Learning Experiences
- Highlights interesting student projects for data visualizations, often outside of the usually thought of charts and graphs.
- Instructional method to help students make better sense of graphs, includes interesting graphs as examples.
Stanford: Teaching Data science in Secondary School
- Syllabus for a Stanford University course with the primary emphasis on tools and techniques for teaching secondary grade level data science and data science integration. Includes project ideas, relevant readings, videos, etc., and examines many aspects of data science as its own subject and how different content areas might teach data science principles.
START HERE – WDS Data Story Bytes (DataBytes) Teacher Guide
- Lesson plans for short data talks, including the data visualization, related questions, and possible teacher prompts.
Study Hall: Data Literacy – YouTube
- Engaging videos covering the many facets of data literacy at a very basic level (no math required). Most videos are about 10 minutes long.
- Created lesson plans for middle school that uses CODAP for working with the datasets provided.
- Article outlining how to help students move from working with small, student collected data to working with “big data.”
- Data visualization tool designed for middle school and up. License purchase required to work outside of preview mode.
Truman State University Data Science Math Modules
- Individual data science math modules created for use in 5th grade – Algebra II classrooms, showcasing how data science can be incorporated into math curriculum already being taught.
- Short data talks based on data visualizations, complete with worksheets ready to print for students to see the graph and write their thoughts. Graphs cover many topics and subject areas.
- Data exploration platform with created content and curated datasets for math and science. Limited access for free, unlimited access with a premium account.
- Stanford professor who has published many scholarly articles related to data science education, and who teaches classes about teaching data science at the K-12 level.
Weapons of Math Destruction by Cathy O’Neil
- An easy to read book about the darker side, and sometimes unforeseen, consequences of the ever growing world of data science.
What Is Data Visualization? Definition, Examples, And Learning Resources
- Data visualization primer created by Tableau.
What’s Going On in This Graph? – The New York Times
- A free offering during the academic year. NYT includes an explainer video of how they run this engaging activity. New graphs posted every Friday, discussion the following Wednesday with the American Statistical Association, and a reveal on Thursday.
- Free resources that are suitable for secondary school educators in math, physical sciences, social sciences, computers and more. Requires signing up and then the free materials are sent to your email.
- Citizen science website with exportable data that can then be used on CODAP, Google sheets, etc. We used the Penguin Watch project for a 7th grade data science math module.
These resources either relate directly to using data in Social Studies classes or can be used that way with a little creative thinking. To jump in right away have your students analyze texts with one of the DataBasic tools, check out the Data Literacy YouTube series, or check out some of the data talks available (look through archived ones to find a relevant topic) through the New York Times, Turner’s Graph of the Week, and DataBytes, or check out the moving graphs available at GapMinder. Use government data to support lesson topics; the Census Bureau has tutorials and data available, as well as Data.gov. Information is Beautiful has intriguing data visualizations that can support current events discussions.
- Article looking at ways to incorporate digital and low-tech versions of data visualizations and how those can help students engage with the material and move beyond fact collecting and closer to thinking like a professional in the field. In particular, in creating their own visualizations students were able to make deeper, more sophisticated connections between the information provided.
ASA Data Visualization Poster Competition for Grades K–12
- Poster competition with cash prizes. Often used for science projects, but there is not any subject area limitation, just guidelines for the type of question, data collected, etc. Could be from any area with student and teacher interest.
- Free, research-based, integrated Computer Science and Data Science modules for Math, Science, Business and Social Studies classes grades 5-12.
Census Bureau Data
- Data from the U.S. Census Bureau, including tutorials, ready to use tools, visualizations, as well as accessible data.
Class 11: Teaching Social Studies with Data Visualizations – Ed Methods
- Blog post by a social studies teacher highlighting social studies related data visualization tools for use in the classroom.
- A great tool for anyone using data in some capacity. If this is new to you, you may need to watch some tutorials to figure everything out, but with a little tutoring and some experimenting it is easy to get started.
Curriculum Connections with Scratch!
- Scratch coding is a free coding program. The “curriculum connections” outlines ideas for how to incorporate the software in disciplines beyond computer science.
Data and Districts: Gerrymandering and Big Data in American Democracy
- Created lesson plan for high school government and statistics classes that looks at the intersection between the constitutional principle of apportionment, partisan gerrymandering, and data science.
Data Feminism by Catherine D’Ignazio and Lauren F. Klein
- Open access textbook (or available for purchase) that discusses data science and data science ethics through the lens of intersectional feminism, and how it goes way beyond gender, looking at the power of data science: who has it and who does not. Easy to understand, interesting, and informative for anyone interested in data science.
- Aimed at developing data literacy skills, especially in high school librarians, so they can better assist students learning to read and write with data.
Data Stories | Urban Institute
- Free, created lesson plans to help educators guide students through different datasets and the stories they might find there. Each story is a starter kit for educators at different levels–grades 3-5, grades 6-8, or grades 9-12.
- Features extremely simple to engage with tools for beginning to analyze data, and includes short, overview videos and lesson plans for how to teach each tool.
- The home of the U.S. Government’s open access data. Find data, tools, and resources to conduct research, design data visualizations, and more.
Dear Data THE PROJECT — Dear Data
- A fun, low-tech, easily accessible project that can be recreated with students. Scroll to the bottom of the page for thoughts on how to do the project in your classroom.
- Data visualizations of current topics, beautifully done. Includes resources and a book list for anyone wanting to dive deeper into the world of data visualizations.
- Free personalized professional learning to support teachers and instructional coaches in developing expertise in teaching statistics and data science in grades 6-12, i.e. if you don’t feel 100% confident in your own abilities to teach data literacy skills check out this resource to boost your own understanding.
integrated Computational Thinking
- National Science Foundation funded project aiming to support middle school teachers to include computational thinking integrated learning experiences in their pedagogy, specifically focused on social studies, English language arts, and art.
- Free census and survey data from around the world integrated across time and space. IPUMS integration and documentation allows one to study change, conduct comparative research, merge information across data types, and analyze individuals within family and community contexts. Creator Steven Ruggles was named a 2022 MacArthur Fellow.
International Data Science in Schools Project
- Curriculum frameworks for Introductory Data Science to help develop courses for high school.
- Website providing free educational lessons covering a wide variety of topics: art, reading and language arts, history, math, science, computing, life skills, etc.
Machine Learning and the Social Studies
- Article outlining different machine learning projects teachers can use to interact with different digital collections including the Newspaper Navigator and Civil War Photo Sleuth among others.
- Created, artistic maps as a generative theme. Also discusses color considerations, perception, etc. From this link you can also access the larger website including other map sets and created lesson plans.
New Forms of History: Critiquing Data and Its Representations | The American Historian
- Article discussing how to critique data visualizations and why that is important. Also features a couple interesting visualizations.
- (The proof is in) The Pudding is a digital publication that creates visual essays about interesting cultural data. They are often pretty, sometimes interactive, and have occasionally gone viral.
- Website providing interesting, interactive, visuals about global issues, including access to their data. They also have prepared, modular lessons that can easily be used within the classroom.
Resources for Data Science Education | DS4E Coalition
- Data Science resources compiled by Data Science 4 Everyone divided into Teach, Learn, Datasets, and Document Library. Information includes a short description, appropriate grade levels, and any software needs.
RIDDLE – Research in Design for Discovery in Learning Experiences
- Highlights interesting student projects for data visualizations, often outside of the usually thought of charts and graphs.
- Instructional method to help students make better sense of graphs, includes interesting graphs as examples.
- Data Snacks are free, quick, created content based off of US Census data. Social explorer as a larger website is a premium tool that allows easy interaction with census data.
Stanford: Teaching Data science in Secondary School
- Syllabus for a Stanford University course with the primary emphasis on tools and techniques for teaching secondary grade level data science and data science integration. Includes project ideas, relevant readings, videos, etc., and examines many aspects of data science as its own subject and how different content areas might teach data science principles.
START HERE – WDS Data Story Bytes (DataBytes) Teacher Guide
- Lesson plans for short data talks, including the data visualization, related questions, and possible teacher prompts.
Study Hall: Data Literacy – YouTube
- Engaging videos covering the many facets of data literacy at a very basic level (no math required). Most videos are about 10 minutes long.
- Short data talks based on data visualizations, complete with worksheets ready to print for students to see the graph and write their thoughts. Graphs cover many topics and subject areas.
- Data from the U.S. Census Bureau, including tutorials, ready to use tools, visualizations, as well as accessible data.
- Free, curriculum modules to promote statistical thinking and data literacy through investigations of social and economic conditions in the U.S. Designed for math classrooms.
- Stanford professor who has published many scholarly articles related to data science education, and who teaches classes about teaching data science at the K-12 level.
Weapons of Math Destruction by Cathy O’Neil
- An easy to read book about the darker side, and sometimes unforeseen, consequences of the ever growing world of data science.
What Is Data Visualization? Definition, Examples, And Learning Resources
- Data visualization primer created by Tableau.
What’s Going On in This Graph? – The New York Times
- A free offering during the academic year. NYT includes an explainer video of how they run this engaging activity. New graphs posted every Friday, discussion the following Wednesday with the American Statistical Association, and a reveal on Thursday.